Snow Optimizer for SAP® Software
Snow Optimizer for SAP® Software allows you to analyze and optimize your SAP licenses and license contracts. The required data for the SAP license management is gathered from the connected SAP systems and then stored and processed in Snow Optimizer for SAP® Software.
Product description
The gathered data and data of the license contracts build the foundation for the analysis of the current state. Based on that, detailed reports give a first impression of the optimization potential. The creation of rules, rule sets, and their execution leads to results that are recommendations for an optimized licensing of all SAP users in all connected systems. This process enables a step-by-step optimization using simulations that do not influence the production systems. In every phase of the simulation and optimization process, the results can be compared with the data of the license contracts. This facilitates compliance analyses and the assessment of possible economic impacts.
As the last step in the optimization process, mass changes to user master data are stored temporarily in change lists. Once these changes are approved, they are triggered by the master system and will be transferred selectively to the satellite systems. Afterward, the change lists hold a complete audit trail of all modifications carried out.
Snow Optimizer for SAP® Software also includes the measurement of engines, an extensive analysis of authorization roles, activity checks, features to check for indirect accesses, and so much more.
Product architecture
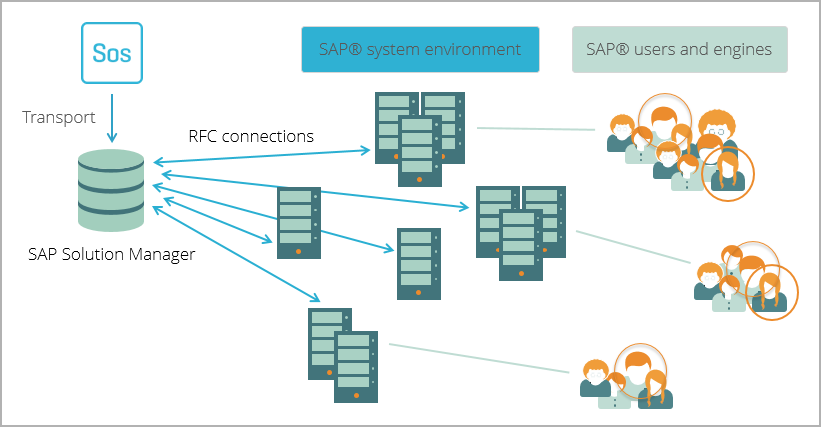
Snow Optimizer for SAP® Software is installed on a master system, usually represented by the SAP Solution Manager. The master system is connected to satellite systems via RFC connections. Those RFC connections work in both ways so data from the master system to satellite systems and from satellite systems to the master system can be transferred. That facilitates data gathering from connected systems and changing data on connected systems.